Nappies sell steadily. Orders don't.
Lee, Padmanabhan & Whang, 1997. The paper that named something everyone in supply chain knows: demand is calm, yet the further you get from the customer, the more orders swing. With a simulation to play with.
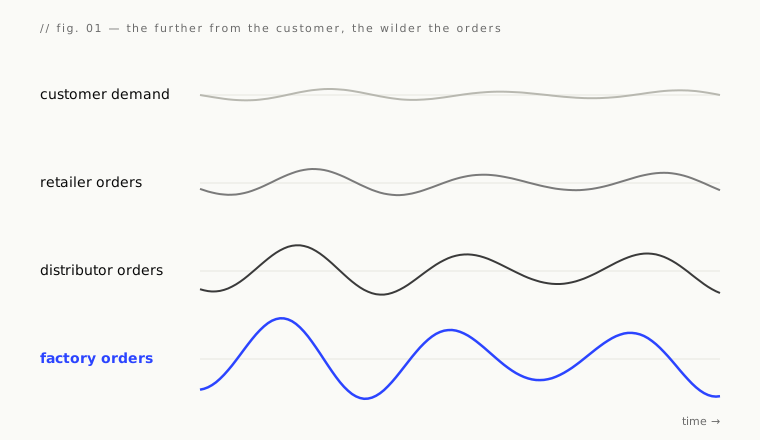
In the mid-1990s, logistics executives at Procter & Gamble were looking at data for Pampers nappies. Consumption was almost flat: babies use roughly the same number of nappies every week. Yet retailers' orders to distributors swung noticeably, distributors' orders to P&G swung even more, and P&G's orders to its own raw-material suppliers swung most of all.
No crisis, nothing unusual. Just calm demand that turned into a wave as it travelled up the chain. Lee, Padmanabhan and Whang gave it the name we still use: the bullwhip effect — a small flick of the wrist, a violent crack at the tip.
1. The phenomenon
The definition is simple: order variability grows as you move up the supply chain, from the customer towards the factory and its suppliers. And it isn't an isolated case: the authors find it in very different industries, from Hewlett-Packard printers to grocery retail. It's also what happens in the Beer Game, the simulation born at MIT in the 1960s: students and managers lined up in a chain create huge waves out of almost constant demand.
The cost is concrete: excess stock in one place and stock-outs in another, capacity sized for peaks and then idle, poorly planned transport, forecasts that are always off. Everyone pays for the swing, even though nobody wanted it.
2. Four causes
The strongest part of the paper shows that the bullwhip doesn't come from anyone being irrational. It comes from behaviours that are reasonable, taken one by one.
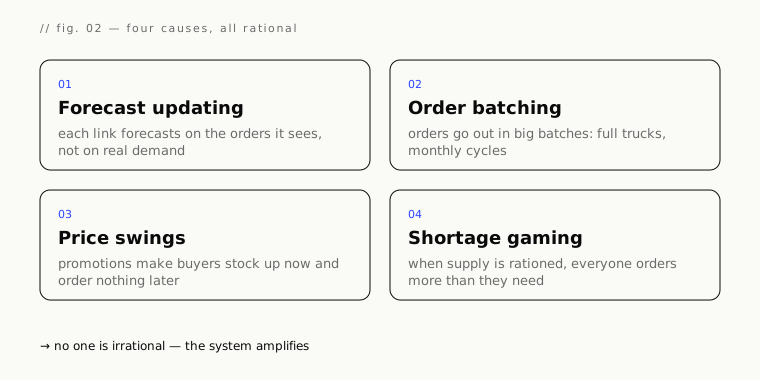
- Demand signal processing. Each link forecasts demand from the orders it receives, not from actual consumption. A small increase is read as a trend, safety stock is added, and the next link sees an even bigger increase. The longer the lead time, the more the error multiplies.
- Order batching. To save on transport and handling, orders go out in blocks: a full truck, once a month. The supplier doesn't see continuous demand, it sees spikes and silence.
- Price variations. Promotions and volume discounts push buyers to buy a lot when it's cheap and nothing when the price goes back up. Purchases stop following consumption and start following the price list.
- Rationing and shortage gaming. When goods are scarce and the supplier allocates in proportion to orders, everyone inflates their orders to get enough. When the shortage ends, the orders vanish — leaving the supplier with meaningless data.
3. Try it yourself
Below is a four-link chain. Each link uses a simple, prudent rule: it forecasts demand with the average of recent periods and orders enough to cover its lead time. Try lengthening the lead time, using fewer periods to forecast (reacting faster), and then sharing sales data.
The model is deliberately simple, but it reproduces the key result studied later (Chen and co-authors, 2000): with moving-average forecasts over p periods and a lead time L, each link amplifies variability by at least 1 + 2L/p + 2L²/p² times. Long lead times and jumpy forecasts are fuel on the fire.
4. The remedies
If the causes are about information and organisation, so are the remedies:
- Share real sales data (POS data, EDI): if everyone sees customer demand, nobody has to guess it from orders. All the way to Vendor Managed Inventory, where the supplier manages the customer's stock.
- Shorten lead times: less time to cover, less stock added to every forecast.
- Smaller, more frequent batches: mixed trucks, cheap electronic ordering, shared logistics.
- Stable prices (everyday low price) instead of stop-and-go promotions.
- In a shortage, allocate on past sales, not current orders: inflating orders stops paying off.
5. What I take away
- Rational local decisions can add up to an irrational global outcome. It's one of the most useful ideas in all of management engineering, and the bullwhip is its cleanest example.
- Before optimising, look at what information flows. Many inventory problems are really data problems: who sees what, and when.
- The paper is almost thirty years old and fully current. The pandemic and the chip shortage showed exactly the rationing game described in 1997: inflated orders, perceived scarcity, then full warehouses.